Wednesday 21 December 2011

Debug Diagnostic Tool


The Debug Diagnostic Tool (DebugDiag) is intended to help in troubleshooting issues such as hangs, memory leaks or memory fragmentation ,slow performance, crashes etc in any process. The tool contained extra debugging scripts focused on IIS applications, Sharepoint, and .NET framework.

You can download DebugDiag from following location.

http://www.microsoft.com/download/en/details.aspx?id=26798


I have updated steps on the DebugDiag 1.2. In this example, I have put one exception in Commerce Server side. This exception fire after 10 minutes of continuous execution. 

  1. Start the DebugDiag.exe from C:\Program Files\DebugDiag
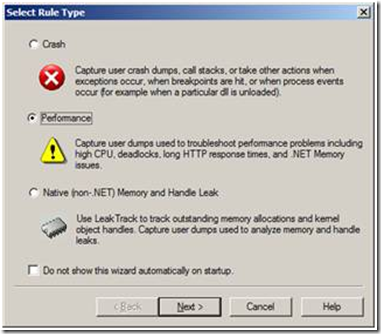
  2. In the Add Rule dialog box, select Performance option and click Next
    image
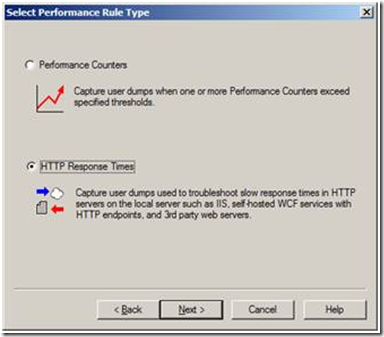
  3. Select HTTP Responses Times option, click Next:
    image
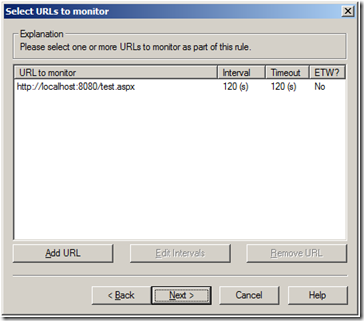
  4. Click Add URL, select the "Generate regular 'ping' requests" option, fill a typical link of AOS_PRD web site, I use "localhost:8080/test.aspx" as one sample here:
    image
    Select 120 as the Ping every and Timeout after fields. Click OK.
  5. After test the URL by following the wizard, Click Next:
    image
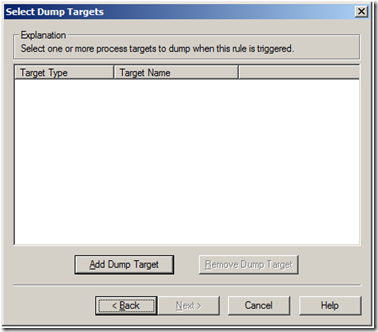
  6. Click the Add Dump Target:
    image
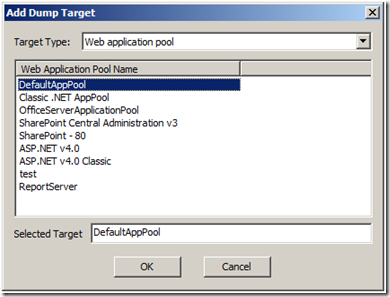
  7. Select the Web Application pool for your application, such as Commerce Server site you stress tested:
    image
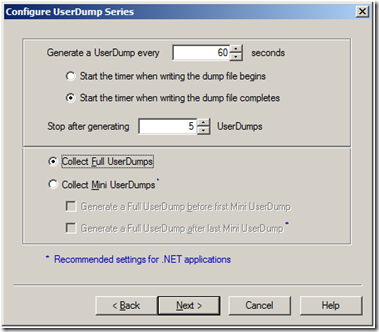
  8. Configure the UI as below, click Next:
    image
  9. Click Next and finish the Wizard. The Rules tab will be like this:
    image

After above steps, if the application (Which is in DefaultAppPool, which we have selected) cannot give response in 2 minutes, then Memory dump will be created automatically.

Above is simple way to take the memory dump.

So after running the load test, when system does not respond we need to do following options to collect log,

a) Open DebugDiag tool.

b) Go to processes tab select “w3wp.exe” process name and right click & do “Create Full user Dump”.

Make sure that your drive has enough space to store dump.

Once you have your memory dump then using WinDBG, load the dump file and load up SOS and start finding the issues.

You can get perfect information about how to find the bottle neck using memory dump from the following articles.

http://blogs.msdn.com/b/tess/archive/2008/03/17/net-debugging-demos-lab-6-memory-leak.aspx

http://blogs.msdn.com/b/tess/archive/2008/03/25/net-debugging-demos-lab-7-memory-leak.aspx


Hope this will help you to find out exact problem for the hung, memory leak and slow performance.
Tuesday 20 December 2011

Performance Tools Part 4


There are many tools available to check the performance of site. This tools give the recommendation to improve further to optimize performance. I’m going explain about more than 15 tools so divide this post into 4 part.

This is Part 4 and going to cover,

12. Rapid Search Metrics (http://rapid.searchmetrics.com/en/seo-tools/site-analysis/website-speed-test,46.html)

13. Pylot (http://www.pylot.org/)

14. Page Test (http://sourceforge.net/projects/pagetest/files/pagetest/2.0.0.221/Pagetest_2_0_0_221.msi/download)

15. Multi-Mechanize (http://code.google.com/p/multi-mechanize/)

Part 1, Part 2 and Part 3 – must be reading for performance improvement.

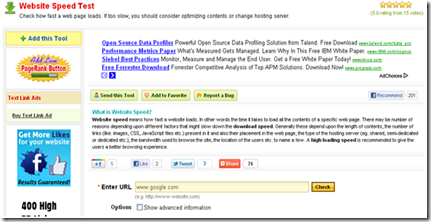
12. Rapid Search Metrics (http://rapid.searchmetrics.com/en/seo-tools/site-analysis/website-speed-test,46.html)

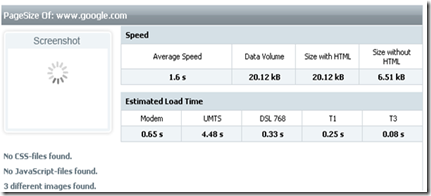
“Rapid Search Metrics” gives detail report for the time taken by the website to open along with the detail of each element of webpage such as images, CSS, Java scripts.

image

Result for Google.com

image

13. Pylot (http://www.pylot.org/)

“Pylot” is important Add-on to generate matrix about HTTP request-response time means HTTP load test. This Add-on is useful for benchmarking of application as well as analysis and capacity planning.

image

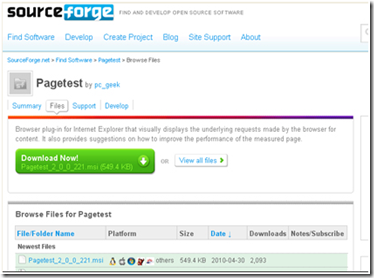
14.  Page Test (http://sourceforge.net/projects/pagetest/files/pagetest/2.0.0.221/Pagetest_2_0_0_221.msi/download)

PageTest is an Internet Explorer plug-in that demonstration the requests made by the browser. It gives the tips to improve the performance of the page.

image

15.  Multi-Mechanize (http://code.google.com/p/multi-mechanize/)

Multi-Mechanize is for web performance and load testing. It generates load report against a web site

image

Now you can run any of above the utility and find out the bottle neck for performance.

Enjoy reading…

Performance Tools Part 3


There are many tools available to check the performance of site. This tools give the recommendation to improve further to optimize performance. I’m going explain about more than 20 tools so divide this post into 4 part.

This is Part 3 and going to cover,

9. Web Tool Hub (http://www.webtoolhub.com/tn561353-website-speed-test.aspx)

10. OctaGate (http://www.octagate.com/service/SiteTimer/)

11. Browser Mob (http://browsermob.com/free-website-performance-test)

9. Web Tool Hub

“Web Tool Hub” is useful to identify bottleneck for performance. It gives the report for loading the page speed for different internet connection.

image

It generates reports for different connection.

image

10 OctaGate

“OctaGate” opens the page and download entire page to give clear picture about how much time is require to open/download pages.

image

11 Browser Mob (http://browsermob.com/free-website-performance-test)

image

“Browser Mob “ checks the performance without running testing script. It generates pie chart for the loading time taken by each objects/elements.


Other tools I’m going to explain in next part (Part 4).

Enjoy reading..