Wednesday, 21 December 2011

Debug Diagnostic Tool


The Debug Diagnostic Tool (DebugDiag) is intended to help in troubleshooting issues such as hangs, memory leaks or memory fragmentation ,slow performance, crashes etc in any process. The tool contained extra debugging scripts focused on IIS applications, Sharepoint, and .NET framework.

You can download DebugDiag from following location.

http://www.microsoft.com/download/en/details.aspx?id=26798


I have updated steps on the DebugDiag 1.2. In this example, I have put one exception in Commerce Server side. This exception fire after 10 minutes of continuous execution. 

  1. Start the DebugDiag.exe from C:\Program Files\DebugDiag
  2. In the Add Rule dialog box, select Performance option and click Next
    image
  3. Select HTTP Responses Times option, click Next:
    image
  4. Click Add URL, select the "Generate regular 'ping' requests" option, fill a typical link of AOS_PRD web site, I use "localhost:8080/test.aspx" as one sample here:
    image
    Select 120 as the Ping every and Timeout after fields. Click OK.
  5. After test the URL by following the wizard, Click Next:
    image
  6. Click the Add Dump Target:
    image
  7. Select the Web Application pool for your application, such as Commerce Server site you stress tested:
    image
  8. Configure the UI as below, click Next:
    image
  9. Click Next and finish the Wizard. The Rules tab will be like this:
    image

After above steps, if the application (Which is in DefaultAppPool, which we have selected) cannot give response in 2 minutes, then Memory dump will be created automatically.

Above is simple way to take the memory dump.

So after running the load test, when system does not respond we need to do following options to collect log,

a) Open DebugDiag tool.

b) Go to processes tab select “w3wp.exe” process name and right click & do “Create Full user Dump”.

Make sure that your drive has enough space to store dump.

Once you have your memory dump then using WinDBG, load the dump file and load up SOS and start finding the issues.

You can get perfect information about how to find the bottle neck using memory dump from the following articles.

http://blogs.msdn.com/b/tess/archive/2008/03/17/net-debugging-demos-lab-6-memory-leak.aspx

http://blogs.msdn.com/b/tess/archive/2008/03/25/net-debugging-demos-lab-7-memory-leak.aspx


Hope this will help you to find out exact problem for the hung, memory leak and slow performance.

Tuesday, 20 December 2011

Performance Tools Part 4


There are many tools available to check the performance of site. This tools give the recommendation to improve further to optimize performance. I’m going explain about more than 15 tools so divide this post into 4 part.

This is Part 4 and going to cover,

12. Rapid Search Metrics (http://rapid.searchmetrics.com/en/seo-tools/site-analysis/website-speed-test,46.html)

13. Pylot (http://www.pylot.org/)

14. Page Test (http://sourceforge.net/projects/pagetest/files/pagetest/2.0.0.221/Pagetest_2_0_0_221.msi/download)

15. Multi-Mechanize (http://code.google.com/p/multi-mechanize/)

Part 1, Part 2 and Part 3 – must be reading for performance improvement.

12. Rapid Search Metrics (http://rapid.searchmetrics.com/en/seo-tools/site-analysis/website-speed-test,46.html)

“Rapid Search Metrics” gives detail report for the time taken by the website to open along with the detail of each element of webpage such as images, CSS, Java scripts.

image

Result for Google.com

image

13. Pylot (http://www.pylot.org/)

“Pylot” is important Add-on to generate matrix about HTTP request-response time means HTTP load test. This Add-on is useful for benchmarking of application as well as analysis and capacity planning.

image

14.  Page Test (http://sourceforge.net/projects/pagetest/files/pagetest/2.0.0.221/Pagetest_2_0_0_221.msi/download)

PageTest is an Internet Explorer plug-in that demonstration the requests made by the browser. It gives the tips to improve the performance of the page.

image

15.  Multi-Mechanize (http://code.google.com/p/multi-mechanize/)

Multi-Mechanize is for web performance and load testing. It generates load report against a web site

image

Now you can run any of above the utility and find out the bottle neck for performance.

Enjoy reading…

Performance Tools Part 3


There are many tools available to check the performance of site. This tools give the recommendation to improve further to optimize performance. I’m going explain about more than 20 tools so divide this post into 4 part.

This is Part 3 and going to cover,

9. Web Tool Hub (http://www.webtoolhub.com/tn561353-website-speed-test.aspx)

10. OctaGate (http://www.octagate.com/service/SiteTimer/)

11. Browser Mob (http://browsermob.com/free-website-performance-test)

9. Web Tool Hub

“Web Tool Hub” is useful to identify bottleneck for performance. It gives the report for loading the page speed for different internet connection.

image

It generates reports for different connection.

image

10 OctaGate

“OctaGate” opens the page and download entire page to give clear picture about how much time is require to open/download pages.

image

11 Browser Mob (http://browsermob.com/free-website-performance-test)

image

“Browser Mob “ checks the performance without running testing script. It generates pie chart for the loading time taken by each objects/elements.


Other tools I’m going to explain in next part (Part 4).

Enjoy reading..

Thursday, 17 November 2011

Performance Tools Part 2


There are many tools available to check the performance of site. This tools give the recommendation to improve further to optimize performance. I’m going explain about more than 20 tools so divide this post into 4 part.

This is Part 2 and going to cover,

1. Pingdom (http://tools.pingdom.com/)

2. Webslug (http://www.webslug.info/)

3. I Web Tool (http://www.iwebtool.com/speed_test)

6. Pingdom http://tools.pingdom.com/)

“Pingdom” checks the loading speed of mostly all the objects of a web application such as Images, RSS, CSS,HTML, Frames etc.

It gives the pictorial representation of loading times of each inner item that is really easy to check the individual loading speed of each element. It generates the different type of report like loading time, loading time of individual element etc

image

7 Webslug

Webslug compares the speed of website with your competitor’s website speed. It has option to compare the website page by page.

image

I have compare google.com and bing.com and got following result.

image

del.icio.us Tags: ,


8. I Web Tool

“I Web tool” is really effective website which gives the ratio of webpage size and the loading time along with average time per KB.

image

I’ll explain more tools in next post.

Enjoy Reading…..

Wednesday, 16 November 2011

Top 15 Speed Optimization and Website Performance Tools

Speed optimization is important for any site. Site may be big portal for e-commerce or targeting to small group of restricted users.

As per my reading some blog about the ranking factor for Google, now site speed is one of the major attribute. Now developers has to go extra importance to loading speed of web application.

There are some aspects that must be handled seriously for increasing the website loading speed:

· Cookie Sizes

· Redirects

· Dom Access

· Use and Size of Images

There are many tools available to check the performance of site. This tools give the recommendation to improve further to optimize performance. I’m going explain about more than 20 tools so divide this post into 4 part.
This is Part 1 and going to cover,

1. GTmetrix (http://gtmetrix.com/)

2. Load Impact (http://loadimpact.com/)

3. Web Wait (http://webwait.com/)

4. Gomez (http://www.gomeznetworks.com/custom/instant_test.html)

5. Site Perf (http://site-perf.com/)

GTmetrix (http://gtmetrix.com/)

GTmetrix (http://gtmetrix.com/) is online service which actually combination of two tools, YSlow and Page Speed. Page Speed is Google’s tool while YSlow is Firefox’s add-on.

Both tools are famous to check the loading speed of a web page. Both have different rules to analyze the bottle neck for performance. It’s quite difficult for the developer to choose among this two (YSlow and Page speed), GTmetrix has solved confusion about selection of YSlow and Page speed.
Site :

image

Result : I got the following result when I have checked for http://www.howto-improveknowledge.blogspot.com/ blog. It clear cut gives that what is YSlow’s Grade and what’s Page Speed’s Grade.

image

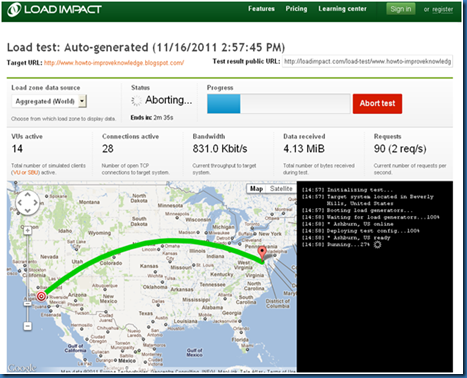
Load Impact (http://loadimpact.com/)

Loadimpact is basically to check the load baring capacity of the web application.

Loadimpact permits to check out that how many users can be handled at a same time by your website without affecting loading speed.

Its free account to check the loading impact of 50 simulated users.

Site

image

Result

image


Web Wait (http://webwait.com/)

Another good web site to check the connection speed. It also provides the toolbar to make the testing process easy.

image

del.icio.us Tags:


Gomez (http://www.gomeznetworks.com/custom/instant_test.html)

Gomez checks for the real time performance test from an external node location. In report it shows the DNS lookup time, connection time, first byte, content download and Redirect Time

image

del.icio.us Tags:


Site Perf (http://site-perf.com/)

It’s another important site to check the site performance. It allows to set “Max thread per host” to check the capacity of application. Read the limitation of Site Perf for better result.
image

del.icio.us Tags: ,

I’m going to cover other tools in next three posts…

Enjoy reading…

Sunday, 13 November 2011

Database Engine Tuning Advisor & Performance Dashboard

SQL SERVER – How to find out bottleneck for performance

This post is to find out bottleneck from Data Base side.

I have followed below approach

1. Using SQL profiler, find out the maximum top 50 Store Procedure’s (SP) which is taking more time.
Base on functional priority, fixed the issue/bottleneck and got good performance boost. I have used best practice for SP. I’ll write another post for SP- Best Practice.

2. Generate trace file from SQL profiler and using “Database Engine Tuning Advisor” find out the missing indexing.
We have implemented the indexing and performance improved at least 15%.

3. SQL is giving two types of reports. One is Standard report and other one is Custom report. Using Performance Dashboard, generate different reports like top 20 Maximum duration report, Top 20 Maximum CPU time report, Missing Indexing report, Maximum logical and physical read report.
I have taken DBA’s advice to reduce the CPU time and physical read.


SQL Profiler is mostly use tool so I’m not going to explain. I’m going to concentrate for rest of two – “Database Engine Tuning Advisor” and “Performance Dashboard”

Database Engine Tuning Advisor

Start “Database Engine Tuning Advisor” from Performance Tool.

image

Once we click on “Database engine tuning Advisor” we get following screen.

image

In workload part, we have to give trace file which we have created using SQL Profiler.

To get the perfect trace file, I have taken trace file from production environment and once testing is over I have save the trace file and use for “Database Engine Tuning Advisor”

In “select databases and tables to tune” part, you can select the require DB or specific table/s.

After that click on ‘Start analysis”, it gives the recommendation is we have done wrongly.

Performance Dashboard

SQL by default gives two type of reports.

1. Standard Report

2. Custom Report

For Performance Dashboard, I have to install “SQLServer2005_PerformanceDashboard.msi” which you can download from Microsoft site. You can get from this link from attachment file name SQLServer2005_PerformanceDashboard_Reports.

This is basically for sql 2005. If you select any custom report, it gives error so you run setup.sql into SQL development studio. (If you run on SQL development studio, it creates require tables and SP into another database so we can run performance dashboard reports. Get files on from attachment, SetupFileForSQL2008.

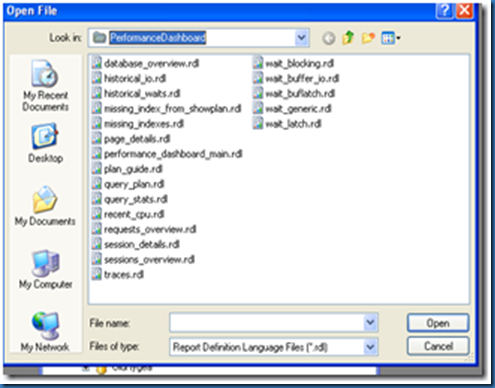
Once you install, select the report from the custom list. Path is

image

And you will get following reports…

image

Select related report and you will get the your database’s perfect report.

Performance Dashboard does not require any trace file.

This way I have identified the bottleneck for performance.
Now I have number of SP which is taking more time. SP’s are huge so instead of changing we have followed some standard approach like

1. If SP has big select statement, create the view and create view index and use view instead of “select” statement in SP.

2. USE CTE (Common Type Expression) instead of temporary table.

3. In some common SP, developer has joined with the Sys.column and Sys.Trigger tables. I have removed all the joins which is done with Sys table and find drastic improvement in overall application.

Hope this is useful. Enjoy reading...

Friday, 11 November 2011

Page Speed

Page Speed – Google’s way to find out bottleneck for performance.

Page Speed is another useful utility which can be used to find out bottle neck for performance. Page speed has some of the rules for better performance. User has to open application using the Page Speed link (https://developers.google.com/pagespeed/) and Page Speed gives valuable suggestions to find out bottleneck and optimize the page for the desire performance.

Following two different ways, once can take advantage of Google Page Speed’s analysis.

1. Page Speed Online – Which has interface and allow user to write URL and give the suggestions. No Download requires for this. More details Page Speed Online

2. Page Speed browser extensions – available for FireFox and Chrome browser. Extensions need to be download, once download it integrate with the browser. More details Page Speed browser extensions

Whatever we used, Google Page Speed gives the same suggestions.

Please read the below link to understand that how harmful poor performance of application for the business.

http://www.technologyreview.com/files/54902/GoogleSpeed_charts.pdf

I’m going to explain Page Speed Online only.

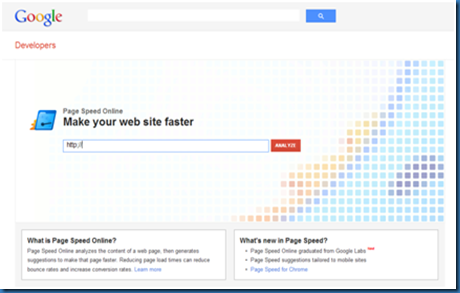
What is Page Speed Online?

Page Speed Online analyzes the content of a web page, then generates suggestions to make that page faster. Reducing page load times can reduce bounce rates and increase conversion rates

Once you click the link - https://developers.google.com/pagespeed/ , you will get below screen.

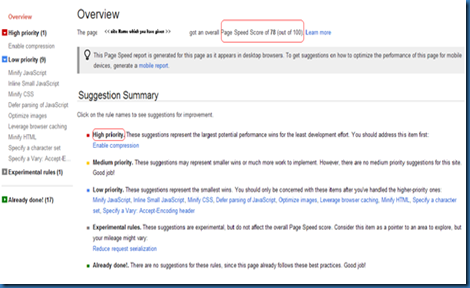
image

Write down you web site address and click on Analyzer, you will get the suggestions. Suggestion vary as per your sites settings. I’ll try to explain Rules which Google has set for the better performance.

image

Google has set the rules and as per the rules Google gives the Score. More score it means good performance .

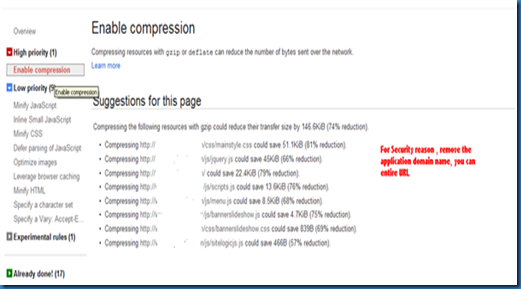
High Priority and Medium Priority one must be convert into “Already done” category using the good page speed help. Once you click on High priority in Overview section (Review above image – top Corner ), you will get suggestion by the Google

image

So once you analyze your allocation, Google Page Speed gives the problem with suggestion, Full fill all the suggestions and again analyze using Page Speed and confirm that whatever changes you have done due that previous “High Priority” rules converts into “already done” or not.

Irrespective of what suggestions you will get, you should consider all the suggestion which Page Speed has mention. You can get more inside from http://code.google.com/speed/page-speed/docs/rules_intro.html

One example is how to Minimize payload size. Google Page Speed has given following suggestion.

Enable compression

Remove unused CSS

Minify JavaScript

Minify CSS

Minify HTML

Defer loading of JavaScript

Optimize images

Serve scaled images

Serve resources from a consistent URL

You can get more details from http://code.google.com/speed/page-speed/docs/payload.html

I think, above may help you to find out issues on performance point of view. I have taken entire concept from Google Page Speed site.

You can get more tools information from http://www.howto-improveknowledge.blogspot.com/

Wednesday, 9 November 2011

Health Monitoring for Web application

Logs are important for any application. When application is in production environment and any issue occur, we have to rely on logs because there is no VSTS debugger available in production box.

There are two type of exception, one is handle by application and other one is unhandled exception. Microsoft operation system take care to write unhandled exceptions into event viewer. But some special treatment require for handle exception.

Microsoft has given some best practice for maintaining the log. Please read on more about best practices from MSDN site.

Here I’m going to discuss only two points,

1) During the development , when developer write try…catch block means handle the exception, it is must to write one entry for exception details into log files or event viewer.

2) If Company has selected to write handle exception into Log files, format of error writing must be decided before so when error occurs , using some tools we can find out the exception easily.

I have mention some of the tools for log reader. Log files are huge in term of line and it is really hard to find out the exception/s. LogParser is useful to find out things easily and fast from the log. It used SQL type of query to find out the result.

You can download LogParser from http://visuallogparser.codeplex.com/

Another good option is HealthMonitoring configuration in WEB.CONFIG file to capture errors into event viewer but again all unhandled errors not handled errors.

You can get more inside from the following like for healthMonitoring.

http://blogs.msdn.com/b/erikreitan/archive/2006/05/22/603586.aspx

In simple term, add the following configuration in all web.config file and run the application

  <system.web>

    <healthMonitoring enabled="true">

      <eventMappings>

        <clear />

        <add name="All Errors" type="System.Web.Management.WebBaseErrorEvent"

startEventCode="0" endEventCode="2147483647" />

      </eventMappings>

      <providers>

        <clear />

        <add name="EventLogProvider" type="System.Web.Management.EventLogWebEventProvider" />

      </providers>

      <rules>

        <clear />

        <add name="All Errors Default" eventName="All Errors" provider="EventLogProvider"

profile="Default" minInstances="1" maxLimit="Infinite" minInterval="00:00:00" />

      </rules>

    </healthMonitoring>

  </system.web>

I think this is useful to find out issues on production server or the computer where debugging is not available.

Tuesday, 8 November 2011

ANTS – Memory Profiler

ANTS Memory Profile can be downloaded from http://www.red-gate.com/products/dotnet-development/ants-memory-profiler/. It is not free, you can get 14 days trial version. Its license product and really worth to purchase for company. I really impress by ANTS memory profiler and I got some crucial bottle neck for the performance.

ANTS memory profiling is tool which gives the idea of memory consumption during the life cycle of application. I haven’t explore 100% but I got good hits to improve the performance.

We have to take “Memory Snap Shot” and compare the result. Suppose we have to identify that after the first save into Data Base, how many unwanted objects are still in memory, than take first snap shot before the save click and take other one after the click. Ants profiler gives the functionality to compare both.

ANTS profiler gives graphical reports and it’s easy to understand. Even you can get advice about how to improve performance by ANTS.

Here some of the graphs which ANTS Memory profile has given. I have developed dummy application and used 14 days trial version for below report.

Scenario 1: There are 237.9 MB memory for Unmanaged Code. Clearly tells the memory leak in unmanaged code.
Second point, check the Generation 2 memory, It should not be so higher.

clip_image002

Scenario 2: As per the ANTS “Having many large fragments increases the likelihood of memory problems. ANTS Memory Profiler also shows the percentage of total free memory accounted for by large fragments. If the number of large fragments is high, and the percentage of free memory accounted for by those fragments is also high, problems are likely to occur sooner.” .this application has Number of large fragments 28 and percentage of free memory is very high 99.7%

clip_image002[4]

Scenario 3: Report for large classes. If you check string and String[] takes 9.30 and 4.6 MB respectively. Need to check why so much memory consumption for all 4 categories.

clip_image002[6]

I have dig into the code and find out the problem which ANTS memory profiler has given. Here is some of the finding

Scenario

Check Point

Analysis

Probable Resolution

1

There are many String objects that are exist into memory that are not require as per the ANTS.

Unregistered” of event are missing. So whatever objects that are refer by that event has still reference, So GC is not releasing object.

Add the Unregistered” of event into appropriate event. http://www.red-gate.com/products/dotnet-development/ants-memory-profiler/walkthrough

2


Use StringBuilder instead of String concatenation.

Change of

string[] to List<sting>

arrayList to List<T> - to
avoid boxing and unboxing

Array to List<T>

Avoid Object[], use to the specific class object

Remove the String variable has “” value (No value)

Don’t use Toupper or Tolower, use String.Compare with ignore case false.

3

Large Object fragments

as per ANTS memory profiler. “Having many large fragments increases the likelihood of memory problems. ANTS Memory Profiler also shows the percentage of total free memory accounted for by large fragments. If the number of large fragments is high, and the percentage of free memory accounted for by those fragments is also high, problems are likely to occur sooner.”

Whatever object above 85KB is Large object and GC is not handling of it. Find out this objects and try to split into multiple objects that are less than 85KB.

4

Unmanaged code

Dispose or destructor should be implemented for unmanaged code

Implemented Dispose. Use IDispose interface.

I think this useful. Keep sharing your thoughts on this.

Monday, 7 November 2011

.NET 4.5

.NET 4.5 Developer Preview

Microsoft has released .NET 4.5 developer preview on 13 September 2011. You can download from http://go.microsoft.com/fwlink/?LinkId=225767

As usual, there many new feature added by the Microsoft. You can get list below. I have taken from the MSDN.

· .NET for Metro style apps

· Core New Features and Improvements

· Web

· Networking

· Windows Presentation Foundation (WPF)

· Windows Communication Foundation (WCF)

· Windows Workflow Foundation (WF)

There are many videos available for .NET 4.5 , find below for your reference.

Video

What’s new in .NET 4.5

http://www.google.co.in/url?sa=t&rct=j&q=.net%204.5%20chaneel%209%20video&source=web&cd=5&ved=0CDsQFjAE&url=http%3A%2F%2Flanyrd.com%2F2011%2Fbldwin%2Fshkqr%2F&ei=3xS4TpeMJ8PqrAeL4_XQAw&usg=AFQjCNFuubVvX5BFOWOkKrJpTlGbrOD27w

.NET 4.5 : Size-on-disk improvement

http://www.google.co.in/url?sa=t&rct=j&q=.net%204.5%20chaneel%209%20video&source=web&cd=4&ved=0CDQQFjAD&url=http%3A%2F%2Fchannel9.msdn.com%2Fposts%2FNET-45-Size-on-disk-improvements&ei=3xS4TpeMJ8PqrAeL4_XQAw&usg=AFQjCNGbxxUpf8JNhLYHQ5IEhGHHeMUYww

.NET 4.5: Eric St. John - Reducing Reboots During Framework Installation

http://www.google.co.in/url?sa=t&rct=j&q=.net%204.5%20msdn%20video&source=web&cd=1&ved=0CBsQFjAA&url=http%3A%2F%2Fchannel9.msdn.com%2Fposts%2FNET-45-Reducing-Reboots-during-Framework-Installation&ei=hBa4Toe1HITyrQfnvojbBA&usg=AFQjCNG4NOvyMyDwTsGTROrFNmeRUhyyjg

Tutorial

As usual, MSDN is the best source to start learns.

http://msdn.microsoft.com/en-us/library/ms734712(v=vs.110).aspx

http://msdn.microsoft.com/library/ms171868(VS.110).aspx

http://forums.asp.net/

If you are interested to know the history of DOT NET FRAMEWROK, go through http://en.wikipedia.org/wiki/.NET_Framework

I have taken all the reference from the MSDN.

Enjoy Learning.......

PowerShell

PowerShell and SharePoint – Basic Concept

PowerShell offers a new ‘commandline’ interface allowing you to manage several different Microsoft products.

PowerShell offers options for both groups Administrators and Developers , so whether you want to automate and manage your SharePoint farm, or just quickly write an update script for your sites. PowerShell allows you to do both.

PowerShell is a commandline interpreter it looks like the old command tool (cmd.exe).

Advantage

1. Generate LINQ .CS file for the entire site using STSADM or PowerShell.

2. Disposing objects that will result in memory leaks

3. Windows PowerShell backup\restore scripts can be developed and scheduled (with Windows Task Scheduler).

4. Easy to create the production environment. Generate the scripts which will “Extract all the solution from farm” and “Import/deploy all the solution into another farm”.

5. You can convert a web application from Classic Mode Authentication to Claims Based Authentication. However, that can only be done using PowerShell commands.

6. PowerShell can be used locally on the server, but you can use it to issue remote commands, which is really handy if you want to retrieve information about another server in your SharePoint farm.

Technorati Tags:

Sunday, 6 November 2011

Suggestions / Recommendations

1. Performance is activity which development team should start parallel. During the development phase, performance should be measure using the mention tools and store the result into source control for future comparison.

2. Design and Architecture should be sign off and any small changes should be documented and validate for performance impact.

3. After every release of milestone –

a. Fiddler and YSLow should be run and analysis for the performance. Store the result into source control for future comparison.

b. Capture result using SOAP UI for all the service and resolve if any conflict.

c. Run ANTS or other profiler and generate report for all the methods. If any issues/bottleneck, resolve immediately.

d. BPA tools must be executed on hosting environment and resolve if any conflict.

e. Capture trace using SQL profiler and send report to DBA for Analysis. The best way is to run load runner and capture the trace file.

f. Capture report for CPU and memory utilization using PAL.

g. Effective Code review should be done. Use “Code Analysis” tool for best practice for coding. Use “Generate Dependency Graph” to identify the complexity.

h. Collect response from UAT(User Experience Team) and work on improvement areas.

4. During the architecture phase

a. Decide how to implement Caching, Exception handling ,Validation and Transactions..

b. Use factory or abstract factory design pattern to create the object of WCF/ WEB Services.

c. Define best practice for integration to other system with performance check points.

5. Develop application in the production type environment. If not possible than at least after each milestone - host the application in production type environment; capture the result using YSLOW/fiddler, compare result with the one which development team has capture in development environment.

6. Implement security (authorization and authentication) as per the client recommendation in first release so any performance related issues popup can be solve before actual development start.

7. After doing any IIS setting changes, require to check concurrency.

8. Involved UAT (User Experience Team) for better user experience.

Technorati Tags: ,,,

SQL Profiler & Advisor tool

Database Engine Tuning Advisor

The Database Engine Tuning Advisor can:

  • · Recommend the best mix of indexes for databases by using the query optimizer to analyze queries in a workload.
  • · Recommend aligned or non-aligned partitions for databases referenced in a workload.
  • · Recommend indexed views for databases referenced in a workload.
  • · Analyze the effects of the proposed changes, including index usage, query distribution among tables, and query performance in the workload.
  • · Recommend ways to tune the database for a small set of problem queries.
  • · Allow you to customize the recommendation by specifying advanced options such as disk space constraints.
  • · Provide reports that summarize the effects of implementing the recommendations for a given workload.
  • · Consider alternatives in which you supply possible design choices in the form of hypothetical configurations for Database Engine Tuning Advisor to evaluate.

Above Database Engine Tuning Advisor’s information taken from the MSDN

Best Practice Analyzer (BPA)

Best Practice Analyzer (BPA)

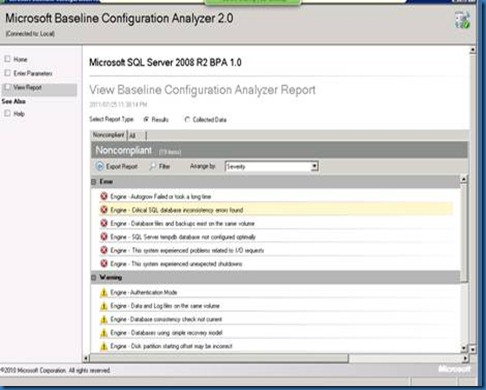
Microsoft comes with BPA to check configuration for the various products with best practices which Microsoft has sent. BPA gives the list of errors (noncompliant) which may cause for the poor performance. Microsoft recommendation is to resolve all the errors(noncompliant) for better performance.

Microsoft has release different BPA for products like BPA for Server 2008, SQL Server . MOSS , commerce Server etc.

Best Practice Analyzer (BPA) for Server 2008

Microsoft comes with BPA to check configuration for the server 2008. It is very useful to check that configuration is as per the Microsoft recommendation or not.

To scan the BPA , click on “Server Manager” -->select Role. It may be possible more than one role for the server. Select any one role and click on “Scan this Role” link. If any noncompliant come, resolve it as per the recommendation given by Microsoft (Attached link with every noncompliant error)

Best Practice Analyzer (BPA) SQL 2008 R2

BPA for SQL 2008 R2 checks that the SQL is configure as per Microsoft recommendation or not. Baseline Configuration Analyzer is prerequisite to scan SQL instance using BPA SQL 2008 R2.

After scanning the SQL BPA, If any noncompliant come, resolve it as per the recommendation given by Microsoft as attached link with every noncompliant error

SQL BPA checks and confirm that tempdb is configure properly or not, DBCC Checker is running or not, MSDTC is configure as per recommendation or not.

Best Practice Analyzer (BPA) for MOSS

The BPA Analyzer for MOSS generates detailed reports to help administrators to get better performance and scalability.

Microsoft Commerce Server 2007 Best Practices Analyzer

The Microsoft Commerce Server Best Practices Analyzer examines a Commerce Server configuration and creates a list of best practices issues it found.

clip_image002

ANTS/PERROMANCE profiler

ANTS and PERMonitor profilers useful to find out which particular method/s are taking more time. Base on finding developer can concentrate on time taking methods.

Modular programming is must to get best result from profiler. Suppose profiler has given the report that “Loading Page” takes more time. Loading page contains CRM call, commerce server call , ADLS and some other calls. If there is no modular programming then it is hard to know that which call is taking more time. If Loading page has different private methods for each individual call than using profiler it is very easy to find which call is taking how much time and base on result start to concentrate on more time taking call.

Best practice is to run profiler for full scenario, check for all methods along with sub methods and come up with matrix for method --> taken time. Base on matrix , start to analysis and resolution for time taking task.

.

Scenario

Check Point

Analysis

Probable Resolution

1

Check for Object Caching :

Run the profiler more than one time for same functionality

Observer that second time object is cache or not.

Implement caching for the object.

Example : If Commerce server instance is generating newly every time for same functionality in same session – instance should be cache.

2

Unmanaged code

Check for memory leak

If memory leak then make sure that all objects are disposed after use.

3

Multithreading is implemented or not.

If method creates any more thread , check for deadlock

Identify the scenario for deadlock and resolve.

All the created new thread must be in try .. catch because any exception occur in child thread cannot popup in parent thread without handling the exception and unhandled exception in thread may cause for performance.

4

Check: Which method/s is taking more time.

Give method break up. Means if method calls 4 sub methods, Ants profiler gives which method takes how much times.[Image5]

Concentrate on sub method which is taking more time. Use threading to reduce

Technorati Tags: ,

SOAP UI

This is another excellent tool to find out bottle neck. Fiddler and YSlow work on URL. Now suppose developer wants to check that which web services/ WCF services take how much response time, then SOAP UI helps.

Scenario

Check Point

Analysis

Probable Resolution

1

Call all the Web services/ WCF servicing and capture the response time.

Find out the services which has taken more than 1 sec

Find out the delay reason for the services.

If delay is due to DB call check the best practice is implemented for DB or not.

If delay is due to specific server like CRM or CS call, check the configuration is proper or not.

Check that proper data caching is implemented or not for relevant situation.

if more than one instance created by application, make sure that instance should be garbage after use.

Use Single ton or Factory methodology to maintain and create the instance of service.

Use multi thread if services are taking more time. Create the new thread and call some related sub method/s parallel. Make sure all the Threading related best practice implemented to avoid deadlock..

2

Network delay

Consider the scenario where IIS for application and IIS for Services are in different server.

Call the service from the IIS server where the application is hosted and capture the response time. Now go to IIS server where the services are hosted and capture the response time for same service. Response times should be nearly identical for both the SOAP UI call.

If capture result has major response time different then problem at network side. Use the infrastructure tools which can give the exact information about where delay in network.

Technorati Tags: ,,

Fiddler

Fiddler is useful to capture request and response for each URL. It’s very popular and easy to use tool. When you enable fiddler, make sure that HTTPS request should be capture. For that do following settings under “Tools --> Fiddler Option.

Following are some major finding/scenarios which can be identify using Fiddler.

Scenario

Check Point

Analysis

Probable Resolution

1

Check NLB and Server’s configuration
Application has used NLB (Network Load Balancing) and there are more than two servers for load sharing. So request given by user may go any of one server. Best practice is to capture more than 20-30 same scenarios fiddler result. The main purpose of capturing same scenarios is to make sure that whatever load balancing done that works perfectly or not.

Check that if some specific requests in fiddler trace files takes more time comparison of rest of fiddler file or not. If yes then it clear cut indicate that either problem in NLB configuration or individual server confirmation.

Disable NLB, point to first server and capture fiddler result and same for other server. If any variation than check the individual server’s configuration. For example one IIS server has enable Static Compression on which other one is off. After identical both the server’s configuration, enable NLB and repeat test to capturing result for surety.

2

Check that for subsequent request

In Web Site, images and CSS files store in local directory (cache) after first request to the server and subsequent request use cache images and CSS files. Due to this only payload for sub sequent request is low compare to first time request.

Fiddle gives “http response code”, it indicate that from where the files are coming. If application is hitting the server, http response code is 200 and for fetching from cache code is 302.

Check that for subsequent request images, CSS and Js files should fetch from team directly not from the server.

Set the Caching properly to avoid server trip for sub sequent request.

Example : for MOSS, enabled BlobCache in web.config file and other option in IIS for output caching.

3

Check for no of static Images

Check that how many images header contains and not dynamic. Even YSLOW can give the static for the no of images.

Club images for the less no of hits for the server.

4

Network delay and time taken statistic

Fiddle gives “Statistic” and “TimeLine” for all the request. Checked all the request which takes more time (1 Sec and more) and then check for “Statistic” and confirm that is there any delay due to network or not.

If fiddle shows the network delay, use the infrastructure tools which can give the exact information about where delay in network.

Remove the unnecessary response generated by code to reduce the payload for request.

Technorati Tags:

YSlow and Firebug

It is proven that for any web application images, Java Scripts files (.js) and CSS must proper . YSlow gives report and suggestion if any of above is not in proper way along with some other valuable suggestion. YSLow tools use the Yahoo’s best practice for Performance[1]. YSLOW works on 34 predefine rules set by the Yahoo team and generate report against rules[1].

After installing YSlow tool, small “YSlow” icon appear at the right bottom of the web browser[Image 1]. Now browse the application. YSlow gives the static result which May be bottleneck for application.

All points which YSLOW gives may or may not be relevant for your application. Considering the following points, site can improve significantly.

Following are some major finding/scenarios which can be identify using YSLOW.

Scenario

Problem

Resolution

1

There are some “Not Found” files which is taking more time to download or render.

Remove all not found files or set the proper path.

2

Some files are (.JS files) Aborted and takes longer time.

Remove or change the appropriate location for the file.

3

Application has many inline Java script and Style

Remove all the inline java script and style. Added into relevant CSS and JS files.

4

Some images are .BMP files.

Change .BMP to .GIF file. BMP file takes 190 KB and converted GIF takes less than 30 KB. Set the parameter that any files should not be more than 40KB (Exception allow for dynamic rendering images)

5

Club Images : Header of application is built using 6 to 10 images.

Try to club images to reduce hit to server.

6

Minify JavaScript and CSS

Removes unnecessary characters to reduce file size to improve load times. Use online tool for Minify JS and CSS files.

Saturday, 5 November 2011

Performance Improvement - Tips

I have started blog for how to improve the performance of the enterprise application. It’s pure knowledge base blog and feedbacks welcome.
This post describes vital tuning parameters and settings to scale the performance up for enterprise application. This paper describes how to identify bottleneck and resolution for performance impact perspective. It explains the typical mistake which can be cause for performance issues, tools which useful for trouble shoot to identify performance issues and check list – guide line which can be useful to avoid mistake in future.
Now most of day to day operations are moving online like shopping, banking, reservations, education etc that’s why “User Experience and Performance” has become vital to success for business. Performance impacts on “Higher Customer Satisfaction” and “Improved End User Productivity”. Many times web site takes longer time to response and due to frustration user migrate to the different same functional site. This way business loses customers. Developer or application owner should avoid such downtime. There are some tools which tell that where the performance down and give the best resolution to avoid or solve the bottleneck.
This blog talks about how to scale the performance up for web application - what are the root causes for the poor performance and how to identify and solve for better performance.
 

Business Scenario

B2C e-Commerce web portal use the following products/technologies to give better security, fast development and better user experience to end user.
  • MS Forefront TMG - for safely and productively use the Internet without worrying about malware and other threats. It’s front server for e-Commerce web portal and accepts request from the end user. Network Load Balancing configure here for better performance and scalability.
  • MOSS and CE (Commerce Server) - for reduced costs in site development and deployment as well as to achieve reach and better shopping experience.
  • CRM – to store and follow up the customer, account details and marketing campaigns.
  • Network Load Balancing for higher performance and scalability of the portal.
  • SQL Failure Cluster for availability if any instance of SQL is down.
  • IIS 7.5 as a hosting server for MOSS, CE and CRM.
Development team has developed the e-Commerce web portal and deployed on the production environment and suddenly performance is not as the development environment has.
One of the reasons for poor performance is - development team has developed entire application in Virtual Machine (VM) not in to real time environment suggested in production deployment architecture. They have installed all the servers in single VM and finished the development. That’s why during development they haven’t taken care for Firewall, network cluster, SQL failure over cluster etc. when application is installed in stage environment/production environment for UAT as per the deployment guideline, major performance issue popup.
Other reason is not implemented best practices for code and integration to other system point of view. During the construction phase, no one from development team has review/check that code written for integration is most optimum or not.
Performance is activity which development team should start parallel. Tools help the team to identify the bottleneck.


Troubleshooting

There are different tools which can be used to identify the bottleneck of performance. Each tool is unique in feature and help in different ways.


Technorati Tags: ,,,,