ANTS Memory Profile can be downloaded from http://www.red-gate.com/products/dotnet-development/ants-memory-profiler/. It is not free, you can get 14 days trial version. Its license product and really worth to purchase for company. I really impress by ANTS memory profiler and I got some crucial bottle neck for the performance.
ANTS memory profiling is tool which gives the idea of memory consumption during the life cycle of application. I haven’t explore 100% but I got good hits to improve the performance.
We have to take “Memory Snap Shot” and compare the result. Suppose we have to identify that after the first save into Data Base, how many unwanted objects are still in memory, than take first snap shot before the save click and take other one after the click. Ants profiler gives the functionality to compare both.
ANTS profiler gives graphical reports and it’s easy to understand. Even you can get advice about how to improve performance by ANTS.
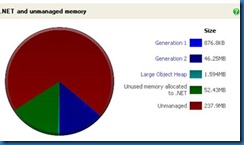
Here some of the graphs which ANTS Memory profile has given. I have developed dummy application and used 14 days trial version for below report.
Scenario 1: There are 237.9 MB memory for Unmanaged Code. Clearly tells the memory leak in unmanaged code.
Second point, check the Generation 2 memory, It should not be so higher.
Scenario 2: As per the ANTS “Having many large fragments increases the likelihood of memory problems. ANTS Memory Profiler also shows the percentage of total free memory accounted for by large fragments. If the number of large fragments is high, and the percentage of free memory accounted for by those fragments is also high, problems are likely to occur sooner.” .this application has Number of large fragments 28 and percentage of free memory is very high 99.7%
Scenario 3: Report for large classes. If you check string and String[] takes 9.30 and 4.6 MB respectively. Need to check why so much memory consumption for all 4 categories.
I have dig into the code and find out the problem which ANTS memory profiler has given. Here is some of the finding
| Scenario | Check Point | Analysis | Probable Resolution |
| 1 | There are many String objects that are exist into memory that are not require as per the ANTS. | Unregistered” of event are missing. So whatever objects that are refer by that event has still reference, So GC is not releasing object. | Add the Unregistered” of event into appropriate event. http://www.red-gate.com/products/dotnet-development/ants-memory-profiler/walkthrough |
| 2 | Use StringBuilder instead of String concatenation. | Change of string[] to List<sting> arrayList to List<T> - to Array to List<T> Avoid Object[], use to the specific class object Remove the String variable has “” value (No value) Don’t use Toupper or Tolower, use String.Compare with ignore case false. | |
| 3 | Large Object fragments | as per ANTS memory profiler. “Having many large fragments increases the likelihood of memory problems. ANTS Memory Profiler also shows the percentage of total free memory accounted for by large fragments. If the number of large fragments is high, and the percentage of free memory accounted for by those fragments is also high, problems are likely to occur sooner.” | Whatever object above 85KB is Large object and GC is not handling of it. Find out this objects and try to split into multiple objects that are less than 85KB. |
| 4 | Unmanaged code | Dispose or destructor should be implemented for unmanaged code | Implemented Dispose. Use IDispose interface. |
I think this useful. Keep sharing your thoughts on this.

![clip_image002[4] clip_image002[4]](http://lh4.ggpht.com/-nlEcMYfmWH0/TrlpXYJNMjI/AAAAAAAABIo/wtIoWkfMIZU/clip_image0024_thumb.jpg?imgmax=800)
![clip_image002[6] clip_image002[6]](http://lh4.ggpht.com/-tHIywlikSik/Trlpcljg6bI/AAAAAAAABI4/pLsSU1uLTuo/clip_image0026_thumb.jpg?imgmax=800)
No comments:
Post a Comment