SQL SERVER – How to find out bottleneck for performance
This post is to find out bottleneck from Data Base side.
I have followed below approach
1. Using SQL profiler, find out the maximum top 50 Store Procedure’s (SP) which is taking more time.
Base on functional priority, fixed the issue/bottleneck and got good performance boost. I have used best practice for SP. I’ll write another post for SP- Best Practice.
2. Generate trace file from SQL profiler and using “Database Engine Tuning Advisor” find out the missing indexing.
We have implemented the indexing and performance improved at least 15%.
3. SQL is giving two types of reports. One is Standard report and other one is Custom report. Using Performance Dashboard, generate different reports like top 20 Maximum duration report, Top 20 Maximum CPU time report, Missing Indexing report, Maximum logical and physical read report.
I have taken DBA’s advice to reduce the CPU time and physical read.
SQL Profiler is mostly use tool so I’m not going to explain. I’m going to concentrate for rest of two – “Database Engine Tuning Advisor” and “Performance Dashboard”
Database Engine Tuning Advisor
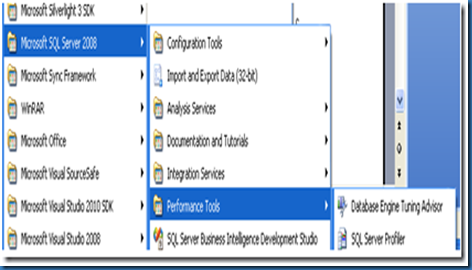
Start “Database Engine Tuning Advisor” from Performance Tool.
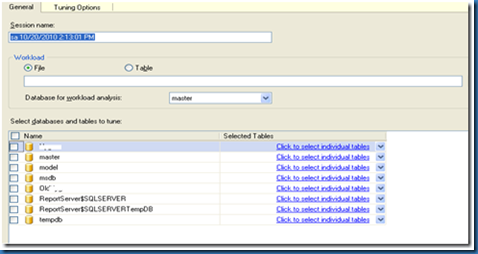
Once we click on “Database engine tuning Advisor” we get following screen.

In workload part, we have to give trace file which we have created using SQL Profiler.
To get the perfect trace file, I have taken trace file from production environment and once testing is over I have save the trace file and use for “Database Engine Tuning Advisor”
In “select databases and tables to tune” part, you can select the require DB or specific table/s.
After that click on ‘Start analysis”, it gives the recommendation is we have done wrongly.
Performance Dashboard
SQL by default gives two type of reports.
1. Standard Report
2. Custom Report
For Performance Dashboard, I have to install “SQLServer2005_PerformanceDashboard.msi” which you can download from Microsoft site. You can get from this link from attachment file name SQLServer2005_PerformanceDashboard_Reports.
This is basically for sql 2005. If you select any custom report, it gives error so you run setup.sql into SQL development studio. (If you run on SQL development studio, it creates require tables and SP into another database so we can run performance dashboard reports. Get files on from attachment, SetupFileForSQL2008.
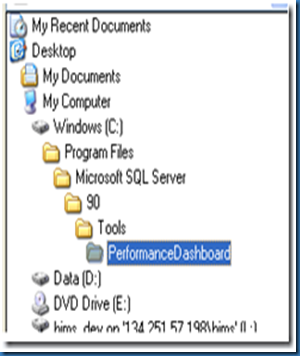
Once you install, select the report from the custom list. Path is
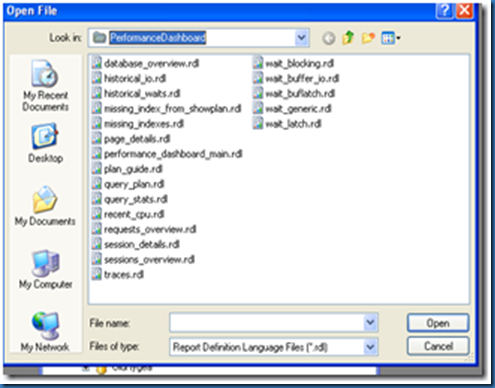
And you will get following reports…

Select related report and you will get the your database’s perfect report.
Performance Dashboard does not require any trace file.
This way I have identified the bottleneck for performance.
Now I have number of SP which is taking more time. SP’s are huge so instead of changing we have followed some standard approach like
1. If SP has big select statement, create the view and create view index and use view instead of “select” statement in SP.
2. USE CTE (Common Type Expression) instead of temporary table.
3. In some common SP, developer has joined with the Sys.column and Sys.Trigger tables. I have removed all the joins which is done with Sys table and find drastic improvement in overall application.
Hope this is useful. Enjoy reading...


No comments:
Post a Comment